
By Kollengode S Venkataraman
e-mail: ThePatrika.@aol.com
The US Congress, as required by the US Constitution, has 435 Members in the House of Representatives, elected from 435 electoral districts from 50 states. Each Congressional district must have approximately the same population (~ 720,000 people).
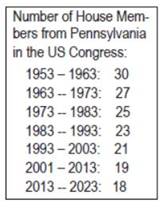
Consequently, states gain or lose House seats depending on the changes in the population determined by the decennial cenÂsus. The population of Pennsylvania relative to the population of the nation has been declining throughout the second half of the 20th century. Hence the number of House seats from Pennsylvania has been shrinking. See the adjacent table. Reference: https://tinyurl.com/Penna-US-House-Seats
Congressmen are elected from each state from “Congressional DisÂtricts,†which are specific geographical areas within the state. The map for each district is redrawn every ten years. The Pennsylvania legislature’s General Assembly (lower house and the senate) in Harrisburg has the authority to redraw the map after each census. However, the governor has to sign off on what the General Assembly proposes.
Pennsylvania is a Moderate State, Relatively Speaking: In elections for the US president and US Senate, the vote split between Democratic and Republican candidates has been between 45:55 or tighter swinging either way. We have voted both for Republicans and Democrats in presidential elections; we have had both Democratic and Republican Governors and US Senators. So, Pennsylvania is a moderate state, relatively speaking.
The 18-member House delegation is skewed towards Republicans. However, if you see the split between the two parties Congressional delegation from Pennsylvania, it is nothing but a scandal. Look at the numbers of GOP and Democratic Congressmen in recent elections from the state:
————————————————————————————————
Election Year and GOP-Democrat Split:
2010: 12-7
2012: 13-5
2014: 13-5
2016: 13-5
————————————————————————————————-
That is, Republicans have 67% of the state’s 18-member Congressional Delegation to the US House, even though the state votes 48-52, swinging either way in presidential and Senate races. The perpetual grip of the Republican majority in the Pennsylvania general assembly garnered such a disproportionately skewed advantage in the US Congress by gerrymandering congressional district maps. They did this by banding and breaking voters identified to vote against them.
Banding: Segments of voters, mostly urban, well known to vote Democratic (for example Blacks, Jews, Asians) would be herded together into very few districts such that in these districts Democratic candidates would win with an 80%-plus majority.
Breaking: Where it suits them, Republicans have drawn the district maps dispersing Democratic voters in a densely populated urban area into multiple Congressional districts thus diluting their effectiveness against them, and gaining a clear advantage for winning in the general elections.
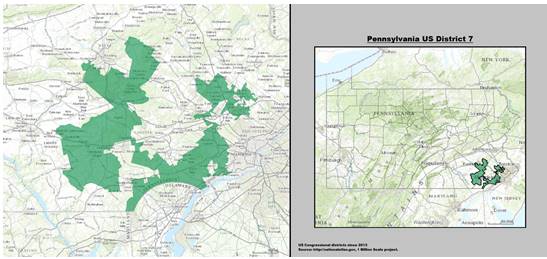
In many districts, once you win in the primary, you coast to victory in the general election. The intra-party primaries are where the battle is won or lost. To know what gerrymandering is, just look at the example of the 7th congressional district, near Philadelphia shown below.
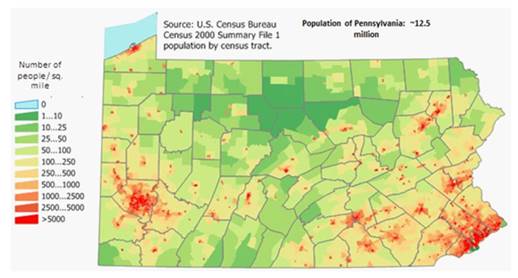
The state’s ~12.75 million population is clustered around urban centers like Philadelphia (6.0 million), Pittsburgh (2.4 million), and Allentown (0.8 million). The state’s population density is shown in the picture below:
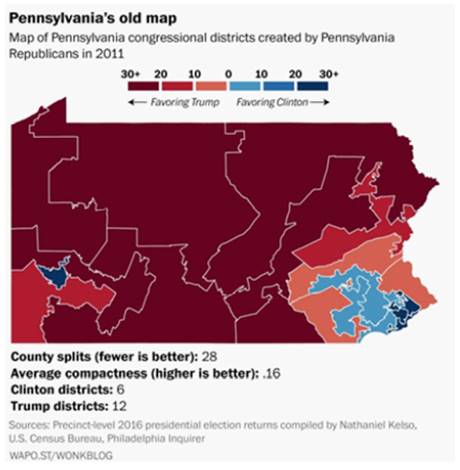
The map of the Congressional districts of the last several election cycles is also shown below. The rural districts are large because they are sparsely populated. This way of drawing the districts gave a disproportionate advantage to the Republicans for winning 13 of the 18 House seats from Pennsylvania’s more than 2/3 of the seats.
Republicans have been in the majority in the Pennsylvania General Assembly for years. This time, a Democrat (Tom Wolf) is the Governor in Harrisburg. Understandably, the governor did not sign off on the Republicans’ gerrymandered redistricting map. When the issue went to the state Supreme Court the League of Women Voters filed the law suit, the court asked the General Assembly to revise their redistricting map, because the Republicans’ plan was “aimed at achieving unfair partisan gain.” The revised redistricting map of the General Assembly too was not endorsed by the Democratic governor.
So, the state Supreme Court took it upon itself to redraw the congressional districts. With the help of a Stanford University professor, the Court redrew the map, saying the map is “superior or comparable” to all the submitted proposals, and is based on “traditional redistricting criteria of compactness, contiguity, equality of population, and respect for the integrity of political subdivisions.” It is a 4-3 decision in the 7-member state Supreme Court. The court-made map is shown below:
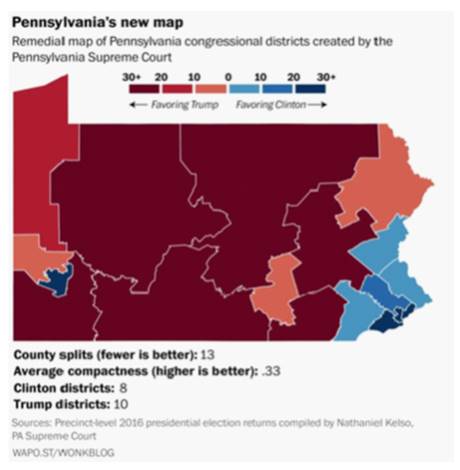
Based on votes cast in the 2016 elections, the new map gives a 10/8 split between the GOP and Democrats compared with the disproportionate 13/5 advantage the GOP now has in the Congressional delegation.
With a more level playing field now imposed by the Pennsylvania Supreme Court, the 2018 mid-term elections to the US Congress in the state become more competitive, representative, and also equitable, in the context of the voting pattern in the state.
We thank the state Supreme Court for correcting the grossly unfair way the GOP-controlled General Assembly in Harrisburg gerrymandered Congressional districts. This and similar decisions in other states correcting the blatant gerrymandering by both parties can finally moderate the partisan deadlock we have been seeing in Washington for the last two decades.
Acknowledgments: The two colored maps of the Congressional districts are from the Washington Post. ♠