
By Kollengode S Venkataraman
e-mail: Â ThePatrika@aol.com
Do you know that the work force in southwestern Pennsylvania (Allegheny County, including the City of Pittsburgh and the six surrounding counties) is the least demographically diverse compared to many other benchmark metropolitan areas in the US? That is what Pittsburgh Today (www.pittsburghtoday.org), an initiative of the Regional Indicator Program (Mr. Douglas Heuck, Program Director) finds in its recent report. The initiative is hosted by the University of Pittsburgh’s Center for Social and Urban Research. Its mission is “Comparing our region to other areas of the country… [on] how we measure up, and what our strengths and weaknesses are…†They attempt to provide a statistical picture of the region “to stimulate a discussion of where we are and where we hope to go.â€
The second report, The Pittsburgh Regional Survey under the aegis of Vibrant Pittsburgh (www.vibrantpittsburgh.org) was released on January 13. Mr. Heuck presented the key findings. Vibrant Pittsburgh’s mission, with support from Pittsburgh-based business executives, elected officials, and charitable organizations, is to promote diversity in work places. Melanie Harrington, the CEO of Vibrant Pittsburgh, led the event releasing the survey.Recently they published two reports, 2015 Pittsburgh Today and Tomorrow and Pittsburgh Regional Survey (2016). These reports are available on line. A key finding in the first report is troubling and worth reproducing: “The share of jobs held by African Americans, Asian Americans, and Hispanic workers in southwestern Pennsylvania is so small that it ranks dead last among 15 regions benchmarked…â€
The presence of Allegheny County Chief Executive Rich Fitzgerald’s and Pittsburgh Mayor Bill Peduto at the event gave additional gravitas. Their participation on a wintry day, with single-digit temperatures and snow all around, highlighted how seriously these two key elected leaders of our region look at the lack of work-place diversity here.
In his opening remarks Fitzgerald acknowledged that our region is the least diverse metro area in the nation, and explained why addressing it is important to the city, county and the region. As Mayor Peduto said in his comments towards the end, Nashville, TN, Louisville, KY, and Cincinnati and Columbus in Ohio have more diverse demographics. The mayor poignantly pointed out that a few decades ago, the Duquesne Club, the exclusive meeting place for corporate executives in town, did not allow Jews to be members, and women were not allowed to be full members. We would not have grown to where we are today, he said, if we had not changed.
Fitzgerald identified two welcome trends in the 2015 Pittsburgh Today and Tomorrow report: young people growing up here prefer to stay here, and educated young people are moving into our region from outside with jobs. After all, Pittsburgh has been identified as one of the More Livable Cities with its excellent public and private schools for children, world-renowned universities, a top-notch healthcare system, nationally ranked sports teams, an excellent airport, museums, theaters, a world class symphony, ballet… … Still, many outsiders’ continue to associate coal and steel with our region, even though today steel and coal are only a very small part of our region’s economy.
If you wonder why workplace diversity is important, consider this: the demography of the US has been changing as shown in the chart below (Ref: The U.S. Foreign-Born Population: Trends and Selected Characteristics, by William A. Kandel, CRS Report for Congress, 2011 (http://fas.org/sgp/crs/misc/R41592.pdf)
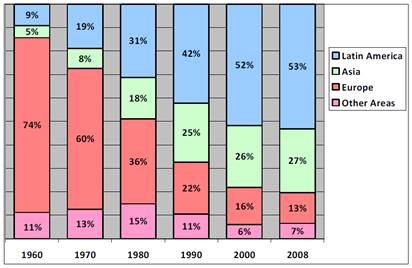
The % of Foreign-Born in the US since 1960.
We can project this trend into the future and see how the mix of US population will be in the decades ahead. The America our children and grandchildren will see will be very, very different demographically. This trend will irreversibly change every aspect of life in the US.
Besides, the population growth in our region between 2000 and 2010 is almost zero compared to, say Charlotte, NC (7% growth), Denver (8.8%), Columbus, OH (4.9%), Indianapolis, IN (4.4%), and Louisville, KY (2.8%). Generally, metro areas that are growing are also more diverse demographically.
In the globalized world today, a diverse population is necessary for our region’s vitality and growth. When US corporations and multinationals based in Europe and Asia want to open offices here, or want to move their headquarters here, one key factor for their evaluation is how demographically diverse the place is to make their current employees move here, or to hire new employees from outside.
Among the many questions the Pittsburgh Regional Survey (2016) asked its respondents were these:
How committed do you think your employer is
- i) to recruiting employees from racial and ethnic minority groups?
- ii) to promoting employees from racial and ethnic minority groups?
Do you agree that the Pittsburgh region welcomes racially/ethnically diverse people?
How racially and ethnically diverse is your workplace?
Do you agree there is value in having a diverse workforce?
The survey also asked this thoughtful question in their questionnaire: How often have you invited someone of another racial or ethnic background to your home?Â
With so many subgroups within the Indian Diaspora here, we need to ask ourselves: How often have you had some serious conversation in your home or in a restaurant with Indians of other linguistic and regional background? Sometimes one wonders whether we are living in our own echo chambers unwilling to learn from others outside our comfort zone.
Laws Changing the US Demographics
(Source: Abraham Mosisa, an economist in the Division of Labor Force Statistics, Bureau of Labor Statistics, in the Monthly Labor Review, May 2002 and http://www.bls.gov/opub/mlr/2002/05/art1full.pdf).
In the 18th and 19th centuries (the early days of the Republic), immigrants reached the Eastern Seaboard mostly from Northern Europe (England, Germany, France) and Africa (slave trade). In the 19th century, Irish immigrants came in large numbers to escape the famous Potato Famine.
Simultaneously, starting in the mid-19th century, Chinese contract labors were brought to the West Coast to work in the gold mine and also to lay the Transcontinental Railroad. You can see in Hollywood Westerns Chinese immigrants barely speaking English operating the laundromats, and sweating it out laying the railroads. The influx of Chinese laborers was stopped by the Chinese Exclusion Act in 1882.
Starting from the 1900s new immigrants from Europe came increasingly from Southern and Eastern Europe (the Italians, the Greeks, the Poles, the Slavs …), mostly Catholic, poorly educated, and with little familiarity with English, both in terms of language and culture.
The Immigration Act of 1917 restricted European immigration and the 1921 Emergency Quota Act applied immigration quota on the basis of nationality and the country of origin. This quota-based act was reaffirmed in the Immigration and Nationality Act of 1952, which remained in force with minor changes till 1965.
The Immigration and Nationality Act of 1965 is a great bench mark in US history. It did away with quota-based immigration that took into account race, national origin, and ancestry. Between 1960 and 2000, the proportion of the foreign-born population that had come from Europe dropped from 74.5 percent to 15.3 percent, while the proportion coming from Latin America increased from 9.3 percent to 51 percent.â€Â See the chart on Page 4. The Nationality Act of 1965 is the reason most Indian-Americans are here as immigrants, naturalized and natural citizens. By country-of-birth in the population among the foreign-born, Europe is way below. Basis: 2010 Census. See the plot below.
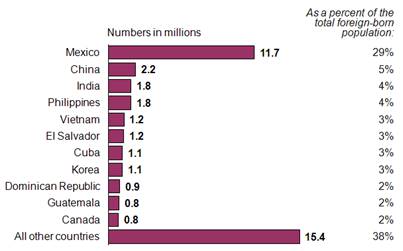
Population of Foreign-Born in the US (US Census 2010 data)
            ♦♦♦♦